INTRODUCTION
A common stereotype of
United States colleges is that students are reckless and always causing havoc.
In this assignment I was given the task to play the role of an independent
researcher and determine if students at the University of Wisconsin- Eau Claire
are the exact reason why city residents are constantly complaining. In this
assignment I will be using Disorderly Conduct violations from all of the City
of Eau Claire during the years of 2003 and 2009. Included with this data is the
exact addresses of the crime. Using this data and bar location data, from the
year 2009, it is my responsibility to determine if the citizens of Eau Claire
are directing their complaints about UWEC students in the right direction.
For this assignment I
will be using ESRI ArcMap to perform a series of spatial analysis tools. I
will be using mean center, weighted mean center weighted standard
distance/deviation (to 1 standard deviation) and I will use graduated symbols
for the 2003 and 2009 crime data to emphasis which areas of the city have more
disorderly conduct.
TERMS
TO KNOW FOR THIS LAB
Mean
Center: Takes all of the data points and figures the center
point of all the points
Weight
Mean Center: Works similar to Mean Center, but you
can put more emphasis/weight on a given factor
Standard
Distance/Deviation: Measures the degree to which features
are concentrated or dispersed around the points (68% of data falls within 1
standard deviation)
Disorderly
Conduct Crimes: Can fall into many different criminal
charges, most notably is crimes of being drunk in public, disturbing the peace,
or loitering in certain areas
METHODOLOGY
The first stage of this
assignment is to find the Mean Center and Weighted Mean Center of the crime
data. During this stage I created 3 maps, will be discussed and shown in the
discussion section, one showing mean center and weighted mean center for the
2003 Disorderly Conduct crimes. The second map will show the mean center and
weighted mean center for the 2009 Disorderly Conduct crimes. The third and
final map of this stage of the assignment will show both the 2003 and 2009 data
on the same map. All maps will show the crime data in graduated symbols,
meaning the bigger the circle the more crimes which have been committed in that
location.
In order to access the
proper tools needed we must open the ArcToolbox and locate the MEAN CENTER tool, which is located under
Spatial Statistics tools > Measuring Geographic Distributions > Mean Center.
This will open up the tool, select the 2003 or 2009 Crime Data. The tool will
be ran for both crime features so order does not matter. After the tool runs it
will produce the mean center, see definition above. The next step of this stage
is to find the weighted mean center for 2003 and then also 2009. Opening up the
same tool as before we can select the crime data from either 2003 or 2009 (both
have to be done eventually) and this time under the weighted category select
COUNT. Be sure to select the crime data and not the Mean Center, otherwise the
tool will not use the crime data but instead use the one point of Mean Center,
giving you false data.
After running the tool
for a total of 4 times, once for 2003 Mean Center, 2003 Weighted Mean Center,
2009 Mean Center and 2009 Weighted Mean Center, I put all four points on the
same map to see how the Disorderly Conduct Crimes appear to be shifting.
The next stage in the
assignment is to find the Standard Deviation/Distance of Disorderly Conduct in
the City of Eau Claire. For this tool we are only looking for 1 standard
deviation, meaning approximately 68% of all crime data should fall within the
circle.
Using the same data as
the previous stage, we are going to create maps showing the standard distances.
This tool is found in the same area as the Mean Center. Spatial Statistics
Tools > Measuring Geographic Distributions > Standard Distance. This
section again will have 3 maps produced from it. One for 2003, one for 2009 and
one showing both 2003 and 2009.
Opening up the Standard
Distance Tool we are going to use the 2003 or 2009 Disorderly Conduct crime
data, again be sure not to select just the mean center or weighted mean center
because that will mess up the data giving you false data. After selecting the
2003 Disorderly Conduct crime data for the input, select COUNT again for the
weighted portion of the tool. Once the tool runs it will give you a perfect
circle on the map, showing you one standard deviation of crime. Technically,
the data is right, but because we are using a Geographic Coordinate System
projection it is not completely accurate because on the real world it would
appear elliptical.
The next step is to
correctly project your data. I used the Wisconsin Central State Planar
projection for my maps. This gave my map the elliptical projection which we
would actually see on a globe. Once projected, I made my circle 60%
transparent, that way I could see the data underneath the circle, and I also
made the outline much thicker, thus ensuing best visualization of the data.
These steps were once again repeated for the 2009 data.
After both the 2003 and
2009 Standard Deviation/Distance data were calculated and mapped, they were
both put on the same map, along with the crime data from both years, the bar
data, mean center and weighted mean center.
The final section of this lab involved finding Z-Score and Standard Deviation. Using the Block Group data for the City of Eau Claire, we will find which areas have the highest and lowest Disorderly Conduct Crimes in terms of Standard Deviations. In order to do this step, we will open the symbology of the Block Groups and then assign a Standard Deviation to the Join_COUNT field, this field is the number of Disorderly Conduct Crimes in each Block Group. Once selected the Block Groups will change colors based on the Standard Deviation compared to the mean.
The final part of this assignment is to locate the Mean Center of bars in Eau Claire. This is done the same exact way as it was when finding the Mean Center for Disorderly Conduct Crimes in 2003 and 2009.
The final part of this assignment is to locate the Mean Center of bars in Eau Claire. This is done the same exact way as it was when finding the Mean Center for Disorderly Conduct Crimes in 2003 and 2009.
RESULTS
After running analysis on
the data I found the Citizens of Eau Claire may be on the right trail for
blaming the UWEC students for causing the most havoc. The Mean Center and
Weighted Mean Centers for both 2003 and 2009 were located about a block or two
from a majority of the Water Street Bars. The weighted mean center for both
2003 and 2009 are located on the Chippewa River near the Lake Street Bridge, in
my opinion I believe that is because student housing is on both sides of the
river. This could mean students who live on the East Side of the Chippewa River
are getting Disorderly Conduct charges on their walks home.
Map
1—Mean Center and Weighted Mean Center of Disorderly Conduct: Eau Claire 2003
 |
| Map 1 |
In this map we see the number of Disorderly Conduct Crimes in blue. It shows a large majority of them to be near Water Street and also near the Police Station. There are several bars located on the map and it appears that where ever a red martini glass is located there are several blue dots located in the general vicinity. The Mean Center for the 2003 data is located near the intersection of Lake Street and Graham Avenue. The Weighted Mean Center is located southwest of the Mean Center, over the Chippewa River near the Lake Street Bridge. This is indicating something is causing a shift in crimes. The Weighted portion of the crime data was the Count Field, this means there are more crimes conducted in one area causing the shift. The data shows that Water Street appears to be the reason for this.
Map
2—Mean Center and Weighted Mean Center of Disorderly Conduct: Eau Claire 2009
Using the same color
scheme as Map 1, blue crimes, red martini glasses representing bars, a yellow dot
for Weighted Mean Center and a green dot for Mean Center. This data again shows a
large portion of crimes located near Water Street Bars, but also we see large
concentrations of crime by Graham Avenue and S. Barstow Street. Other areas of
high Disorderly Conduct include; by the police station and by the hospital. The
Mean Center of all Disorderly Conduct Crime in Eau Claire is near the
intersection of Lake Street and S. Farwell Street. The Weighted Mean Center is
again southwest of the Mean Center (Lake Street Bridge). This appears to be
caused by the large number of Disorderly Conduct Crimes charged by the Water
Street strip of bars.
 |
| Map 2 |
Map
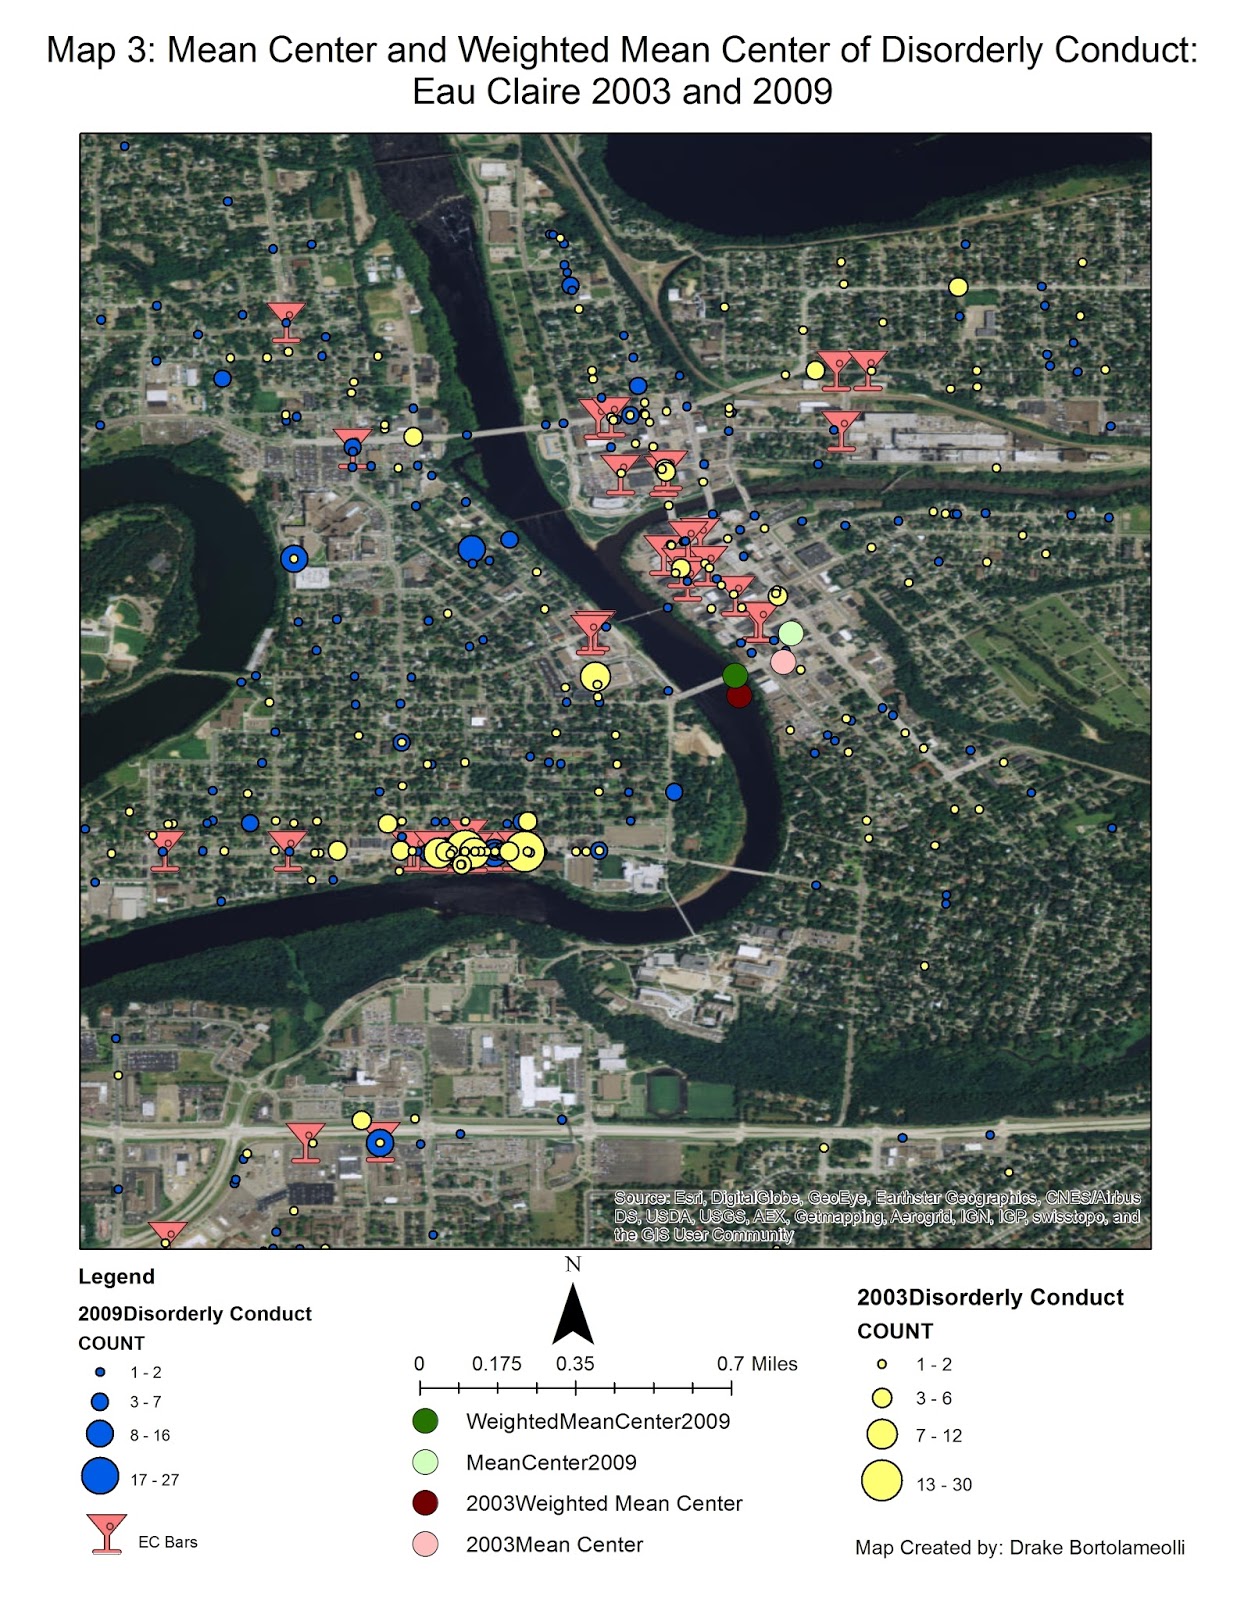
3—Mean Center and Weighted Mean Center of Disorderly Conduct: Eau Claire 2003
and 2009
This map is a combination
of the previous two maps. It is showing the crime count from 2003 and 2009 as
well as the Mean and Weighted Mean Centers from both 2003 and 2009. The map is
showing that over the six year gap the mean center of crime is being shifted
north, away from the believed primary cause of Water Street. The Weighted Mean
Center is also being shifted north. This is meaning that more crimes are being
conducted in 2009 in northern Eau Claire then there was in 2003. And with the
Weighted Mean Center also shifting north, it means Water Street is not the
most influential location, or at least not as much, of all Disorderly Conduct. Yes there are several
Disorderly Conduct Crimes being committed in that area, but there must be other
areas in Eau Claire which are pulling the Weighted Mean Center away from the
area.
 |
| Map 3 |
Map
4—Weighted Standard Distances of Disorderly Conduct: Eau Claire 2003
This map is using a
circle/ellipse to give a visualization of where approximately 68% or 1 standard deviation of Eau Claire Disorderly Conduct Crimes are
being committed. To no surprise, based on previous three maps, the entire
“Student Ghetto” falls within this one standard distance. Looking at the crime
data, there are lots of Disorderly Conduct Crimes being committed in that area, and
there are also a large number of bars which fall inside the circle. Although we cannot directly link Disorderly Conduct Crimes to liquor consumption, the map makes it look like a pretty strong factor. The
Weighted Standard Distance is ran using the Weighted Mean Center as the center
point, and it appears ellipse because we projected the data, if we did not
project the data it would appear as a perfect circle.
 |
| Map 4 |
Map
5—Weighted Standard Distances of Disorderly Conduct: Eau Claire 2009
Again showing an ellipse
of where approximately 68% or 1 standard deviation of Eau Claire crimes are being committed,
we see not much change in location. The “Student Ghetto” again is completely
incased in this ellipse of data. Common with map 4, we are seeing large
concentrations of crimes being committed in close proximity to bars or places
where liquor is available. On the map, inside the one standard distance, if you
draw a diagonal line crossing through the Weighted Mean Center, the map shows
far more crimes being committed in the northwestern portion then in the
southeastern portion. Not being able to link this because we do not have the
exact information on the crimes, but it appears that crime and liquor consumption
may be related in areas of college housing.
 |
| Map 5 |
Map
6—Weighted Standard Distances of Disorderly Conduct: Eau Claire 2003 and 2009
On this map we are
comparing the 2003 Standard Deviation of Disorderly Conduct with the 2009
Standard Deviation of Disorderly Conduct. On the map we see the ellipses are
very similar, but have a slight shit to them. The 2009 data is indicating a
northern and slight western shift in crime. Looking at the map, yellow circles
are 2003 Disorderly Conducts and 2009 Disorderly Conducts are mapped in blue,
it looks like more Disorderly Conducts have been charged in northern Eau
Claire, such as the area just north of Half Moon Lake, also areas near the
confluence of the Eau Claire and Chippewa Rivers. Not being too familiar with
those areas in 2003 I would think that is newly developed area or areas where
the recession may have hit harder.
 |
| Map 6 |
Map
7—Standard Deviation of Disorderly Conduct Crimes by Block Group: Eau Claire
2009
On this map we see the
student housing section of the map to be a dark blue color, and as distance
increases from this area it goes from a light yellow to orange. This is
indicating a change in standard deviation. For the City of Eau Claire there was
a total of 343 Disorderly Conduct Crimes in the 64 Block Groups (2009 Crime
Data). There was a max of 42 Disorderly Conduct Crimes in a Block Group, and
multiple Block Groups with 0. The City had an average (mean) of 5.3593
Disorderly Conduct Crimes per Block Group, with a standard deviation of 7.8149.
Using this data we had to calculate the Z-Score for 3 separate Block Groups. The last part of this map is a green dot centered right in the dark blue Block Groups (2.5+ Standard Deviations). This is the Mean Center for Eau Claire Bars.
 |
| Map 7 |
FINDING
Z-SCORE OF CERTAIN BLOCK GROUPS
Block
Group 41-Location: Oakwood Mall and Surrounding Residential Areas
 |
| The three block groups outlined in black and numbered in Red correspond to the next three problem sets |
Disorderly
Conduct Crimes (Xi): 10
Mean: 5.3593
Standard Deviation: 7.8149
Mean: 5.3593
Standard Deviation: 7.8149
Z-Score
= (10 – 5.3593)/7.8149
Z-Score
= 0.5938
Block
Group 46-Location: Old Downtown and Eau Claire/Chippewa River Confluence
Disorderly
Conduct Crimes (Xi): 40
Mean: 5.3593
Standard Deviation: 7.8149
Mean: 5.3593
Standard Deviation: 7.8149
Z-Score
= (40-5.3593)/7.8149
Z-Score
= 4.4326
Block
Group 57-Location: Southwestern Eau Claire
Disorderly
Conduct Crimes (Xi): 1
Mean: 5.3593
Standard Deviation: 7.8149
Mean: 5.3593
Standard Deviation: 7.8149
Z-Score
= (1-5.3593)/7.8149
Z-Score
= -0.5578
WHAT
IF SCENARIOS…
Using
current trends (from previous section) how many Disorderly Conduct Crimes will
the City of Eau Claire exceed 70% of the time?
Z-Score
= -0.52
-0.52
= (X – 5.3593) / 7.8149
-4.0637
= X – 5.3593
X
= 1.2956
The City of Eau Claire
will exceed 1.2956 Disorderly Conduct Crimes per Block Group 70% of the time
20%
of the time?
Z-Score
= 0.84
0.84
= (X – 5.3593) / 7.8149
6.5645
= X – 5.3593
X
= 11.9238
The City of Eau Claire
will exceed 11.9238 Disorderly Conduct Crimes per Block Group 20% of the time
CONCLUSION
Overall, the data does
show Water Street has had a large number of Disorderly Conducts in both the
2003 and 2009 data sets. The Mean and Weighted Mean Centers do confirm that
Water Street does have a large pull in the city. The Standard Distance also
confirms that students are responsible for a large majority of these crimes,
most of student housing falls within one standard distance of the Weighted Mean
Center. When looking at the Standard Deviation of the City of Eau Claire we can
see the student area housing is over 2.5 Standard Deviations away from the
mean, while other areas are less than 1 Standard Deviation from the mean. The
reason they are less than 1 Standard Deviations below the mean, and not
greater, is because the average was 5.3593, and a Standard Deviation of 7.8149,
which would mean a Block Group would have to have -2.46 crimes, which is not
possible.
Looking through the
results I did find that Water Street was not the only major area where
Disorderly Conduct Crimes were being charged. There were lots filed near the
police station on Lake Street, this may be though because they were transported
there and then processed, marking the location as the police station. Other
areas of alarming concern which I was unaware of was near the confluence of the
Chippewa and Eau Claire Rivers.
There may be several
implications with the results, such as unfiled charges, misfiled charges or
incomplete records. Not knowing the exact reasons why the charges were filed
can be a major issue. At the beginning I defined Disorderly Conduct as
disturbing the peace, there was also loitering as a disorderly conduct charge.
Being a large and broad field of crime, it is uncertain if you could link this
to liquor consumption. Also if you were to walk down Water Street on a Friday
night you would see easily 10 cop cars within a 4 block stretch, but in other
areas of the city you will not see any. That could play a factor into all the
charges on Water Street and very few in other parts of the city.
A Possible solution for
this would be to inform the citizens and teach students about proper behavior.
To answer the question at the beginning of the lab, are the students of UWEC to
blame for this? I would say yes and no. Yes there are a lot of crimes on Water
Street near the bars, and yes that is primarily dominated by students at UWEC,
the Standard Deviation Map (MAP 7) does in deed confirm that students may be to
blame, but I cannot give a guaranteed answer to the issue without knowing the
exact crimes, and if alcohol was indeed involved.
No comments:
Post a Comment